Quick Start
Fire up your terminal, and:
# Install using PyPi
pip install benchpress --user

# Make the Benchpress binaries available
export PATH=$PATH:$HOME/.local/bin
Specify what to benchmark by implementing a Python script that generates commands:
import benchpress as bp
from benchpress.suite_util import BP_ROOT

scripts = [
    ('X-ray',  'xraysim',  ["10*10*1", "20*10*1"]),
    ('Bean',   'galton_bean_machine',  ["10000*10", "20000*10"]),
]

cmd_list = []
for label, name, sizes in scripts:
    for size in sizes:
        full_label = "%s/%s" % (label, size)
        bash_cmd = "python {root}/benchmarks/{script}/python_numpy/{script}.py {size}" \
                    .format(root=BP_ROOT, script=name, size=size)
        cmd_list.append(bp.command(bash_cmd, full_label))

# Finally, we build the Benchpress suite, which is written to `--output`
bp.create_suite(cmd_list)
And run the script:
$ python suites/simple_example.py --output my_benchmark.json
Scheduling 'X-ray/10*10*1': 'python xraysim/python_numpy/xraysim.py --size=10*10*1'
Scheduling 'X-ray/20*10*1': 'python xraysim/python_numpy/xraysim.py --size=20*10*1'
Scheduling 'Bean/10000*10': 'python galton_bean_machine/python_numpy/galton_bean_machine.py --size=10000*10'
Scheduling 'Bean/20000*10': 'python galton_bean_machine/python_numpy/galton_bean_machine.py --size=20000*10'
Writing suite file: my_benchmark.json
The result is a JSON file results.json that encapsulate the commands that make up the benchmark suite. Now, use bp-run to run the benchmark suite:
$bp-run results.json
Executing 'X-ray/10*10*1'
Executing 'X-ray/20*10*1'
Executing 'Bean/10000*10'
Executing 'Bean/20000*10'
Finally, let’s visualize the results in ASCII:
$bp-cli results.json
X-ray/10*10*1: [0.013303, 0.013324, 0.012933] 0.0132 (0.0002)
X-ray/20*10*1: [0.108884, 0.105319, 0.105392] 0.1065 (0.0017)
Bean/10000*10: [0.002653, 0.002553, 0.002616] 0.0026 (0.0000)
Bean/20000*10: [0.005149, 0.005088, 0.005271] 0.0052 (0.0001)
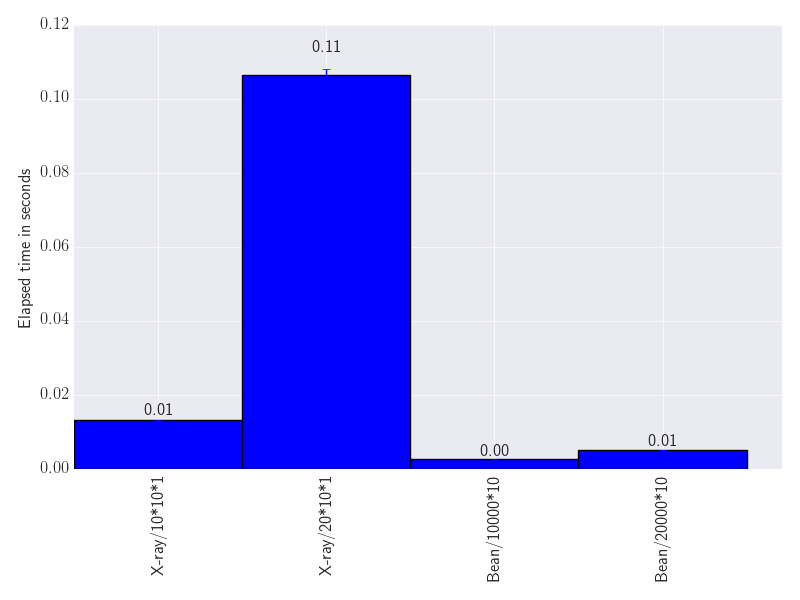
Or as a bar chart:
$bp-chart results.json --output results.pdf
Writing file 'results.pdf' using format 'pdf'.